Risk Tiers
Each token receives a score from 0-100 based on weighted risk signals. The score maps to a tier: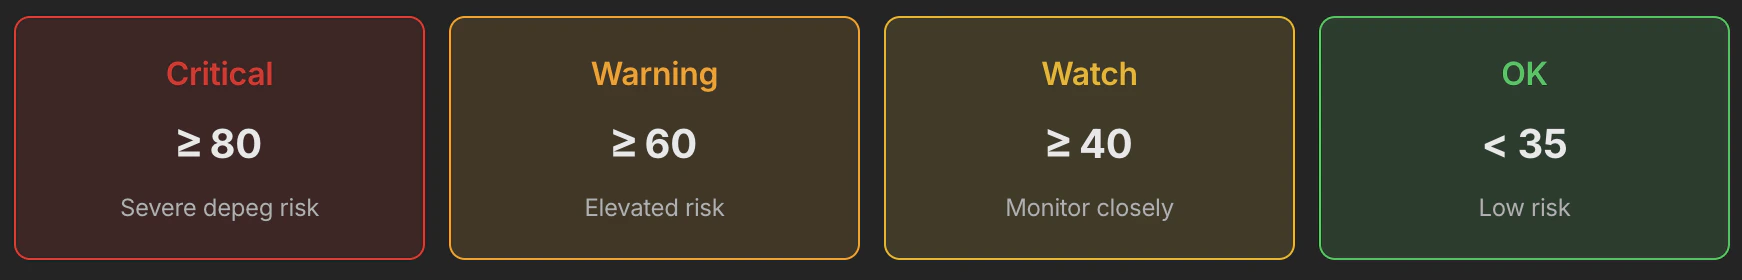
Feature Weights
The final score is a weighted sum of normalized risk signals (each 0-1). Weights sum to 90%, leaving room for future features.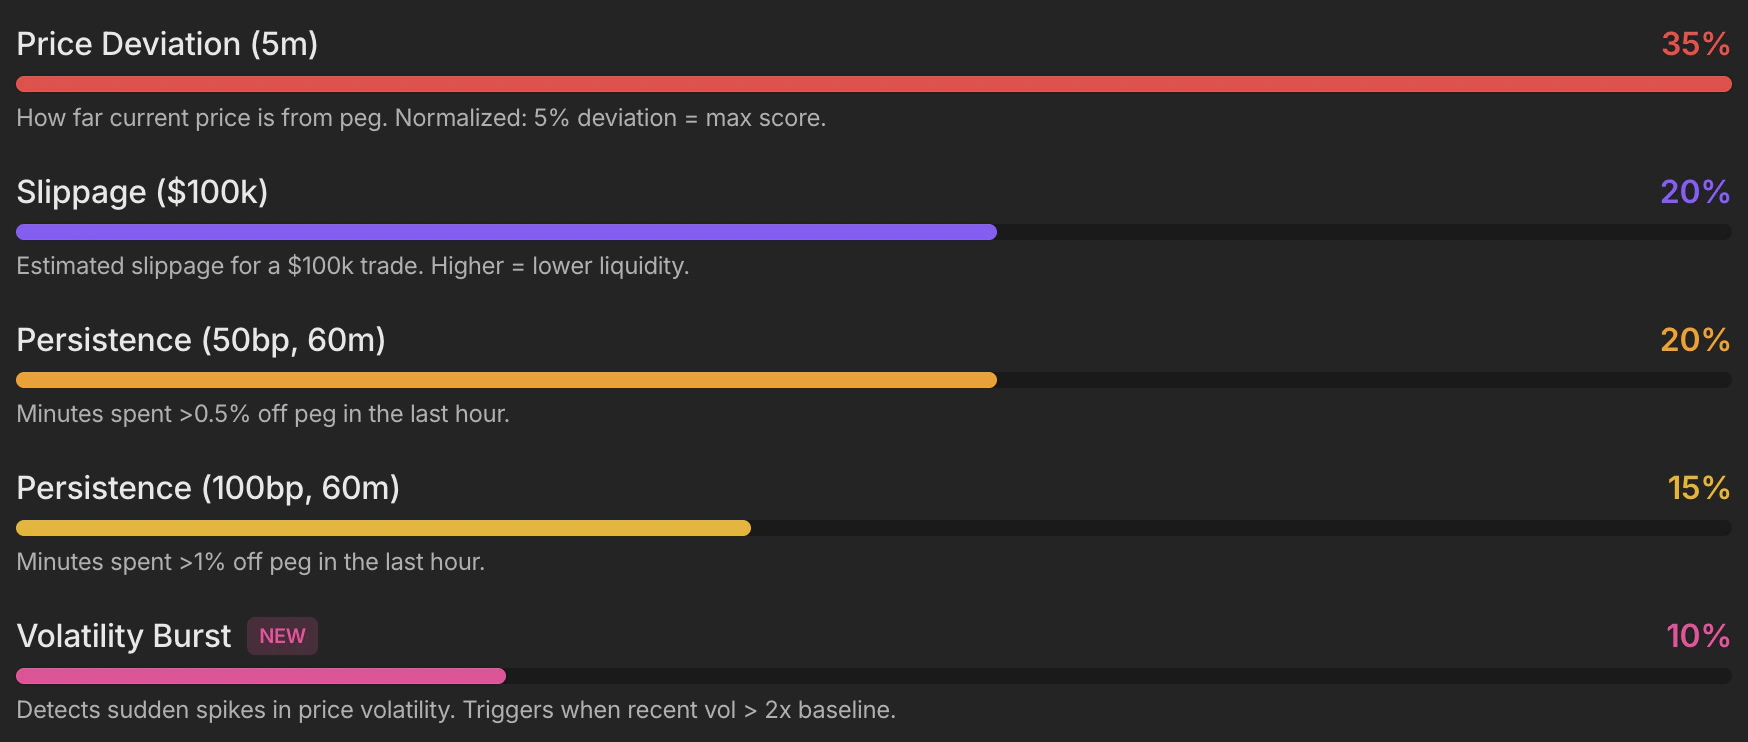
Velocity & Momentum Scoring
Beyond the base score, we track how quickly risk is changing. Rapidly rising scores get boosted for earlier warnings.📈 VelocityRate of score change (points/tick). Positive = worsening risk.
🚀 AccelerationChange in velocity. Helps detect rapidly accelerating depegs.
⚡ Momentum BoostUp to +15 points added when velocity exceeds threshold.
Token Type Adjustments
Different token types have different expected behaviors. The model adjusts for this: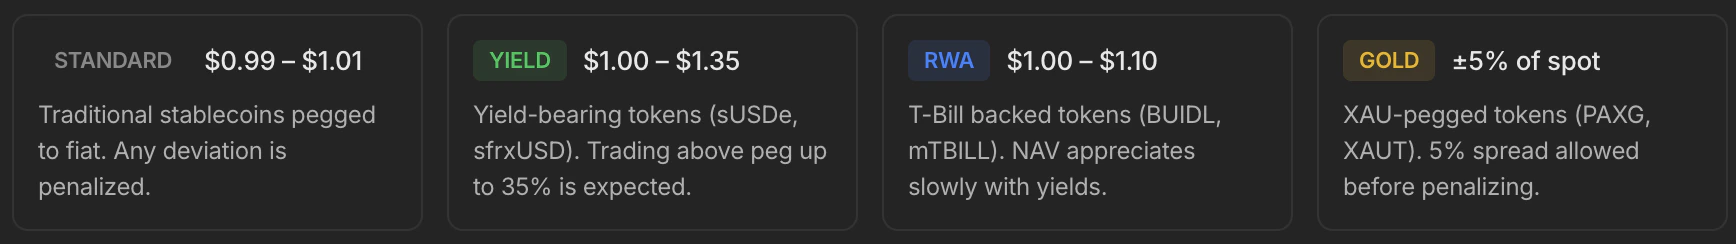
Example Calculation
Token: USDC on Ethereum Price: $0.985 Peg: $1.00 Deviation: 1.5%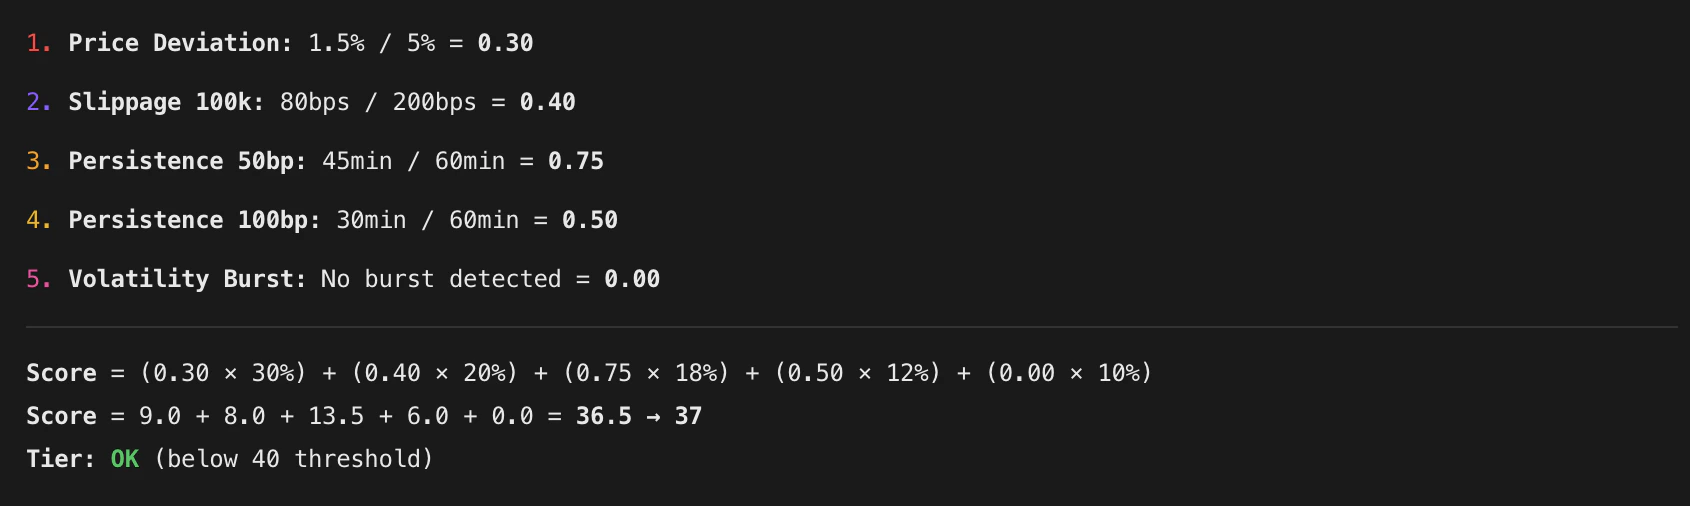
Hysteresis & State Machine
To prevent alert fatigue, tier transitions require sustained conditions:- Upgrade to Critical: 1 tick above threshold
- Upgrade to Warning: 2 consecutive ticks above threshold
- Upgrade to Watch: 2 consecutive ticks above threshold
- Downgrade to OK: 2 consecutive ticks below clear threshold