

Want vault risk coverage on a chain that’s not listed yet? Contact the team — we’re actively expanding chain coverage.
Risk Tiers

Letter Grades
Each vault receives a letter grade derived directly from its composite risk score on a standard 11-band scale. It is a risk rating: lower risk earns a better grade. A+ is the lowest risk, F is the highest risk. The grade always points the conventional way (A+ is best), while the underlyingvault_score is a risk magnitude where higher means worse. Bands are tighter at the safe end and widen as risk rises.
The
vault_grade field is available on all vault records alongside the numeric vault_score (0–100).
Listing Verdict
Every vault receives alisting_verdict — a clear signal for teams deciding whether to integrate, list, or accept a vault as collateral. It’s computed from the composite risk score plus hard blocking conditions, updated with every data refresh.
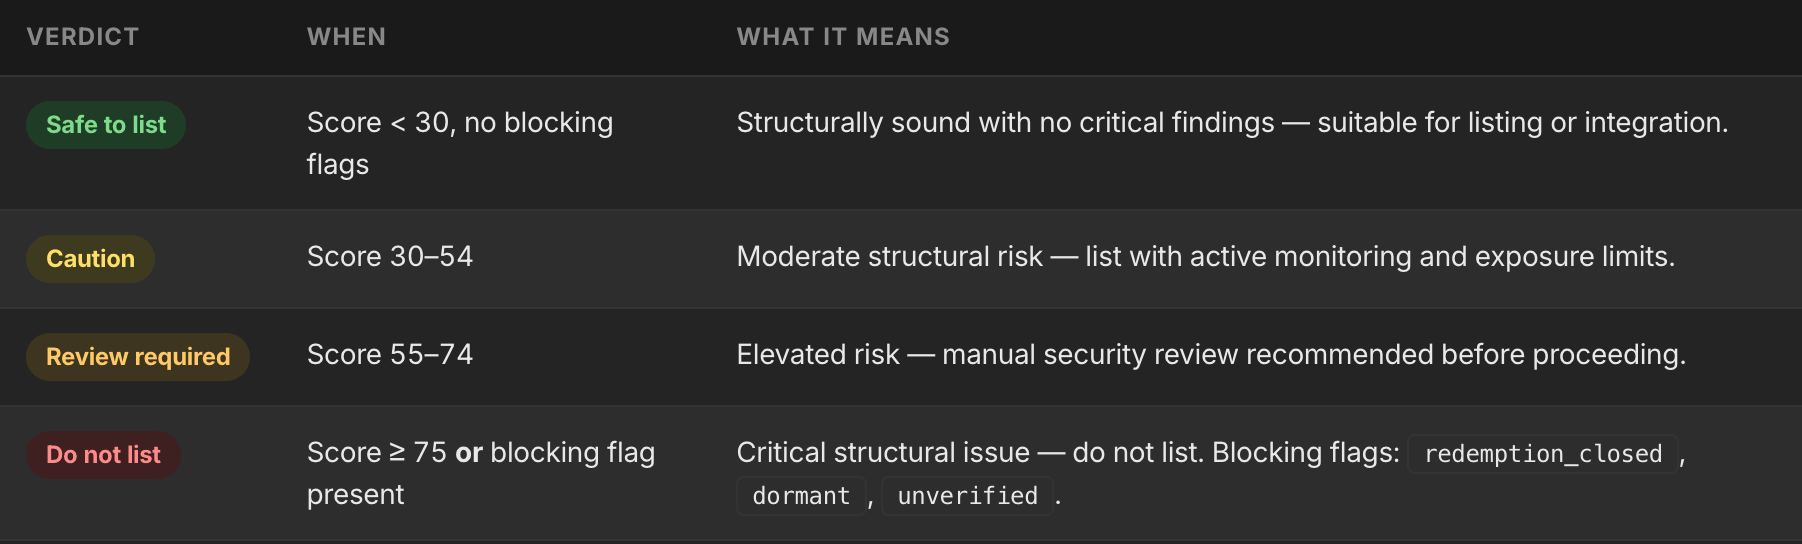
GET /vaults → listing_verdict field on each vault item.
Withdrawal Risk
Thewithdrawal_risk field tells you how freely users can exit a vault right now. For lending vaults, utilization is fetched live every ~5 minutes, so this signal reflects actual on-chain liquidity — not yesterday’s data.
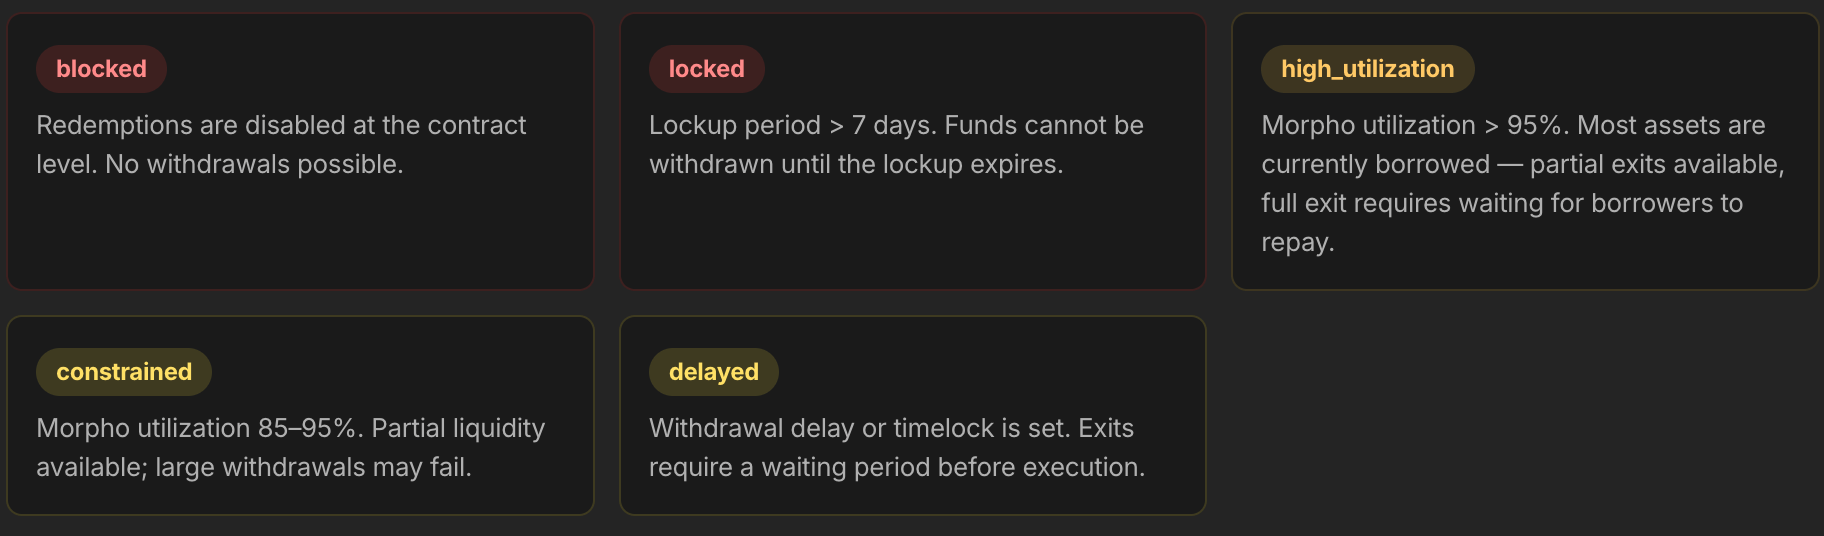
Real-Time Data Signals
Several signals are fetched live at request time and overlaid on top of nightly pipeline data. This means the dashboard reflects current on-chain conditions, not just yesterday’s snapshot.
Price indicator: A green dot (●) next to a share price means a live market quote was available. A grey dot means the price is from the last nightly pipeline run. Prices above $500 or equal to zero are treated as bad data and shown as —.
Score History & Trends
Every vault detail page includes a 90-day score sparkline so you can see whether a vault is improving, degrading, or stable over time. The delta badge shows the score change vs 30 days ago. Each daily snapshot records: • Risk score (0–100) • Tier (low / medium / high / critical) • Active risk flags • Share price • Looping exposure % History endpoint:GET /vaults/[chain:address]/history — returns up to 90 snapshots.
TVL & Share Price History
Two dedicated endpoints expose daily UTC-midnight samples for the chart on the vault detail page. Both accept arange of 7d, 30d, 60d, or 3m (defaulting to 30d) and hoist the most recent point to a latest aggregate so you can render current stats without paging the full series. The stale flag flips true when the latest sample is older than 48 hours or the series is empty.
Per-point
apy_trailing_7d is annualized against the sample 7 days earlier ((price[t] / price[t-7d])^(365/7) - 1) and returns null when the look-back sample is missing or the absolute APY exceeds 100 (clamped to suppress single-day pricing artifacts). Both endpoints return 404 when the vault is not in the verified-vaults catalog; tracked vaults with no samples yet still return 200 with count: 0, latest: null, and stale_reason: 'no_samples_yet'.
Available in the SDK as client.vaults.getTvlHistory() and client.vaults.getSharePriceHistory().
Quality filtering
Each sample carries aquality_flag that captures whether the underlying reading was trusted. By default, the chart endpoints drop samples flagged as capped, diverged, or spike so a single bad pricing artifact never appears as a misleading peak or trough in the line — the BSC USDX 92× over-report that prompted this change is the canonical example.
When samples in the window are dropped, the response is non-silent: the envelope reports
count < days plus filtered_count: N and every returned point still carries its quality_flag. A visible chart kink that lines up with filtered_count is normal and does not indicate a missed daily update. The stale_reason enum disambiguates the four states behind stale: true so consumers can render the right empty-state copy:
Pass
?includeFlagged=true to bypass the allowlist and receive the full raw series with every sample’s quality_flag populated — useful when researching the cause of a flagged event or building a custom marker overlay. filtered_count is always 0 in that mode.
The response envelope also carries schema_version (currently s3); pin it if you’re building a regression harness so additive shape changes don’t fail your assertions silently.
Share Price & Depeg Signals
last_share_price is the vault token price in USD. For yield-bearing vaults — sDAI, sUSDe, Yearn, Fluid — the share price legitimately drifts above $1 as yield accumulates. This is expected behavior, not a risk signal. Depeg flags only fire when the price falls meaningfully below par.

RISK SCORE METHODOLOGY ↗️
Monitoring Status
Each vault is assigned amonitoring_status derived from TVL and trend data. Legacy and deprecated vaults are hidden by default in the dashboard (toggle with ‘Show legacy (N)’).
Actionability Class
Every vault output includes anactionability_class that identifies the dominant risk driver and returns a targeted one-line action recommendation. The class with the highest weighted average sub-score wins.
Action verb (monitor / review / plan / watch / reduce / exit) is selected by combining class × tier. The
actionability_class, actionability_action, actionability_detail, and actionability_class_scores fields are all available in the API output.
Exchange Rate Velocity
ERC-4626 vaults accumulate yield slowly — a 15% APY vault moves ~0.04% per day. A sudden large movement in the exchange rate is a direct indicator of an attack in progress or structural failure.
Previous price is persisted across pipeline runs. No external API required — uses the share price already captured during enrichment.
ERC-4626 Donation Attack Risk
When an ERC-4626 vault is used as collateral in a lending protocol and that protocol prices it viaconvertToAssets(), the vault becomes vulnerable to a donation attack: an attacker transfers assets directly into the vault contract (without calling deposit()), inflating the exchange rate without minting new shares. The lending protocol’s oracle reads the inflated rate and allows overborrowing against the manipulated collateral.
Venus wUSDM (Feb 27, 2024):Attacker donated USDM directly into the wUSDM contract, inflating the exchange rate from 1.0694 → 1.764. Venus used
convertToAssets() as its price oracle with no TWAP or manipulation protection. ~$902K bad debt generated from a $350 initial deposit.DetectionVault is ERC-4626 AND its address appears as
collateralAsset in ≥ 1 active lending market. Queried from live on-chain market data at scoring time.Scoring Impact
erc4626_donation_risk = true → +15 additive penalty + erc4626_donation_risk flag. This is a latent (pre-exploit) structural risk; pair with exchange rate velocity for real-time detection.Large Redemption Alerts
Every 6 hours, Webacy scans 24 hours of on-chainWithdraw events across 600+ vaults (TVL ≥ $500K) to detect concentrated exits before they appear in price data. A vault is flagged when a single wallet redeems more than $500K or more than 1% of vault TVL within the lookback window.
Flagged vaults receive a
large_redemption_alert risk flag and expose four fields: large_redemption_count_24h, large_redemption_usd_24h, large_redemption_max_pct_tvl, and large_redemption_wallets.
Risk Summary (Natural Language)
Every vault includes arisk_summary field — a one-sentence plain-English explanation of why the vault scored the way it did. Generated deterministically from the top weighted sub-score contributors and highest-priority active flags. No LLM required.
Example“Score 74 (HIGH). Primary drivers: restricted withdrawals, centralized governance, unverified/unaudited code. Active signals: yield trap, thin collateral market.”
risk_summary on every vault record. Useful for surfacing in alerts, reports, and API consumers without additional processing.